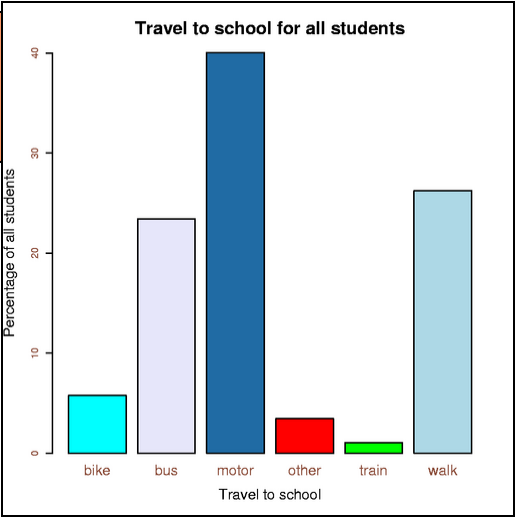
On the left side of the graph is the percentage of students, or how many students there are. Then below there are different types of ways they travel to school. The most common the students traveled was by motor, and the least is by train.
Excellent Danielle, I like the way that you explain what the x axis (means of travel) and y axis (% of students). Amazing that 40%, nearly half of the students travel to school by motor. I wonder if it would be the same for Rm 10 students.
Hi Danielle, Your graph was clear to view and the explanation you wrote was very clear and concise. Well done. Where did you get this data from? Tsana (Karl & Robin's mum)
 On the left side of the graph is the percentage of students, or how many students there are. Then below there are different types of ways they travel to school. The most common the students traveled was by motor, and the least is by train.
Excellent Danielle, I like the way that you explain what the x axis (means of travel) and y axis (% of students). Amazing that 40%, nearly half of the students travel to school by motor. I wonder if it would be the same for Rm 10 students.
ReplyDeleteMrs Parker
Hi Danielle,
ReplyDeleteYour graph was clear to view and the explanation you wrote was very clear and concise. Well done.
Where did you get this data from?
Tsana (Karl & Robin's mum)